E N S Y S T E M S I N C ...
Canadian Distributors of TimeWaver Systems
E N S Y S T E M S I N C ...
Canadian Distributors of TimeWaver Systems
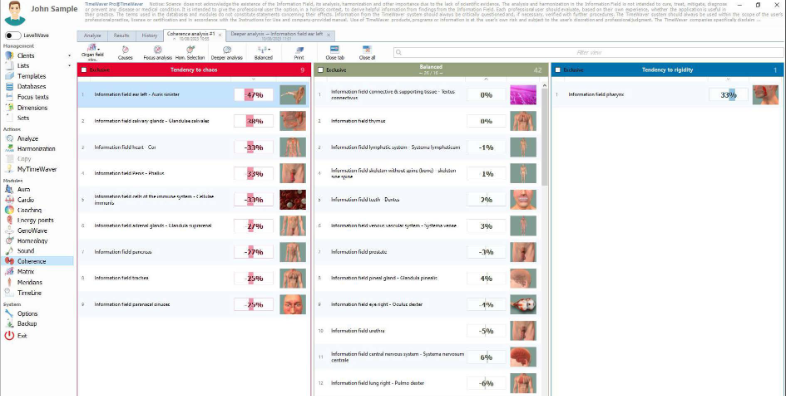
The three columns represent the coherence status of each organ.
The left (red) column represents the active/acute phase with the relevance percentage. The middle column represents within the normal range. The right column (blue) represents the chronic/background phase.
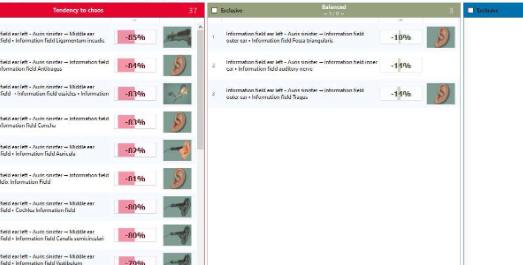
In this report the selected organ can be seen with its anatomical parts with percentages of imbalance
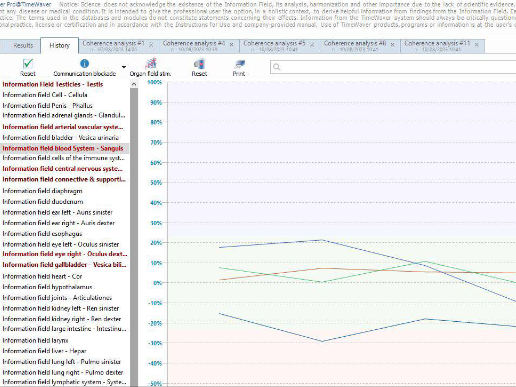
In this report a timeline of the progress of each organ is represented
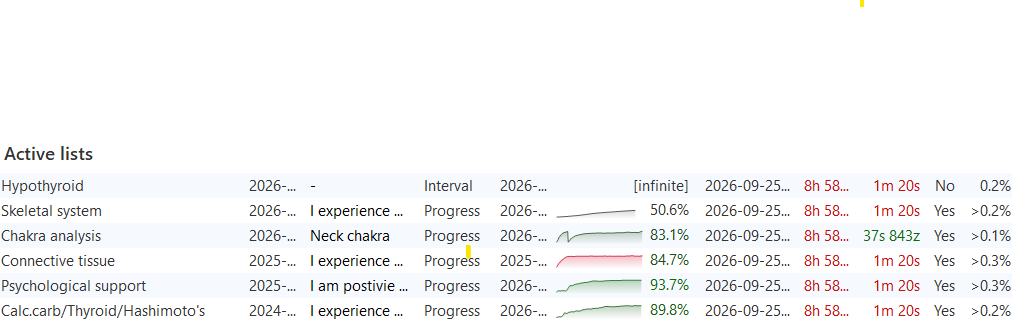
This is an example of treatment lists ready for remote transmission
We need your consent to load the translations
We use a third-party service to translate the website content that may collect data about your activity. Please review the details in the privacy policy and accept the service to view the translations.